Telemetry wiring
sink consumes crucible/telemetry, the suite’s
vendor-neutral tracing and metrics interface. It does not define its own
observability abstraction and it pulls in no telemetry vendor. You pass one
shared Tracer and Meter, the same ones the rest of your service (and the
state kernel) use, and sink records through
them.
m := sink.NewManifold( sink.WithLogger(logger), // *slog.Logger sink.WithTracer(tracer), // telemetry.Tracer sink.WithMeter(meter), // telemetry.Meter)Every seam defaults to a no-op: a discarding slog handler, telemetry.NopTracer(),
telemetry.NopMeter(). An un-instrumented Manifold allocates no backend and does
no IO on the hot path. Observability is opt-in, never a required dependency.
What it records
Section titled “What it records”| Instrument | Kind | Meaning |
|---|---|---|
sink.Sink | span | one fan-out; attributes include the payload type |
sink.sunk | counter | payloads an outlet accepted without error |
sink.failed | counter | non-skip outlet failures (also logged + on the span) |
sink.skipped | counter | outlets that skipped a payload as unregistered |
sink.dropped | counter | payloads dropped at a Reservoir’s buffer cap |
sink.batch_size | histogram | payloads per Reservoir flush |
sink.flush_latency_ms | histogram | Reservoir flush duration |
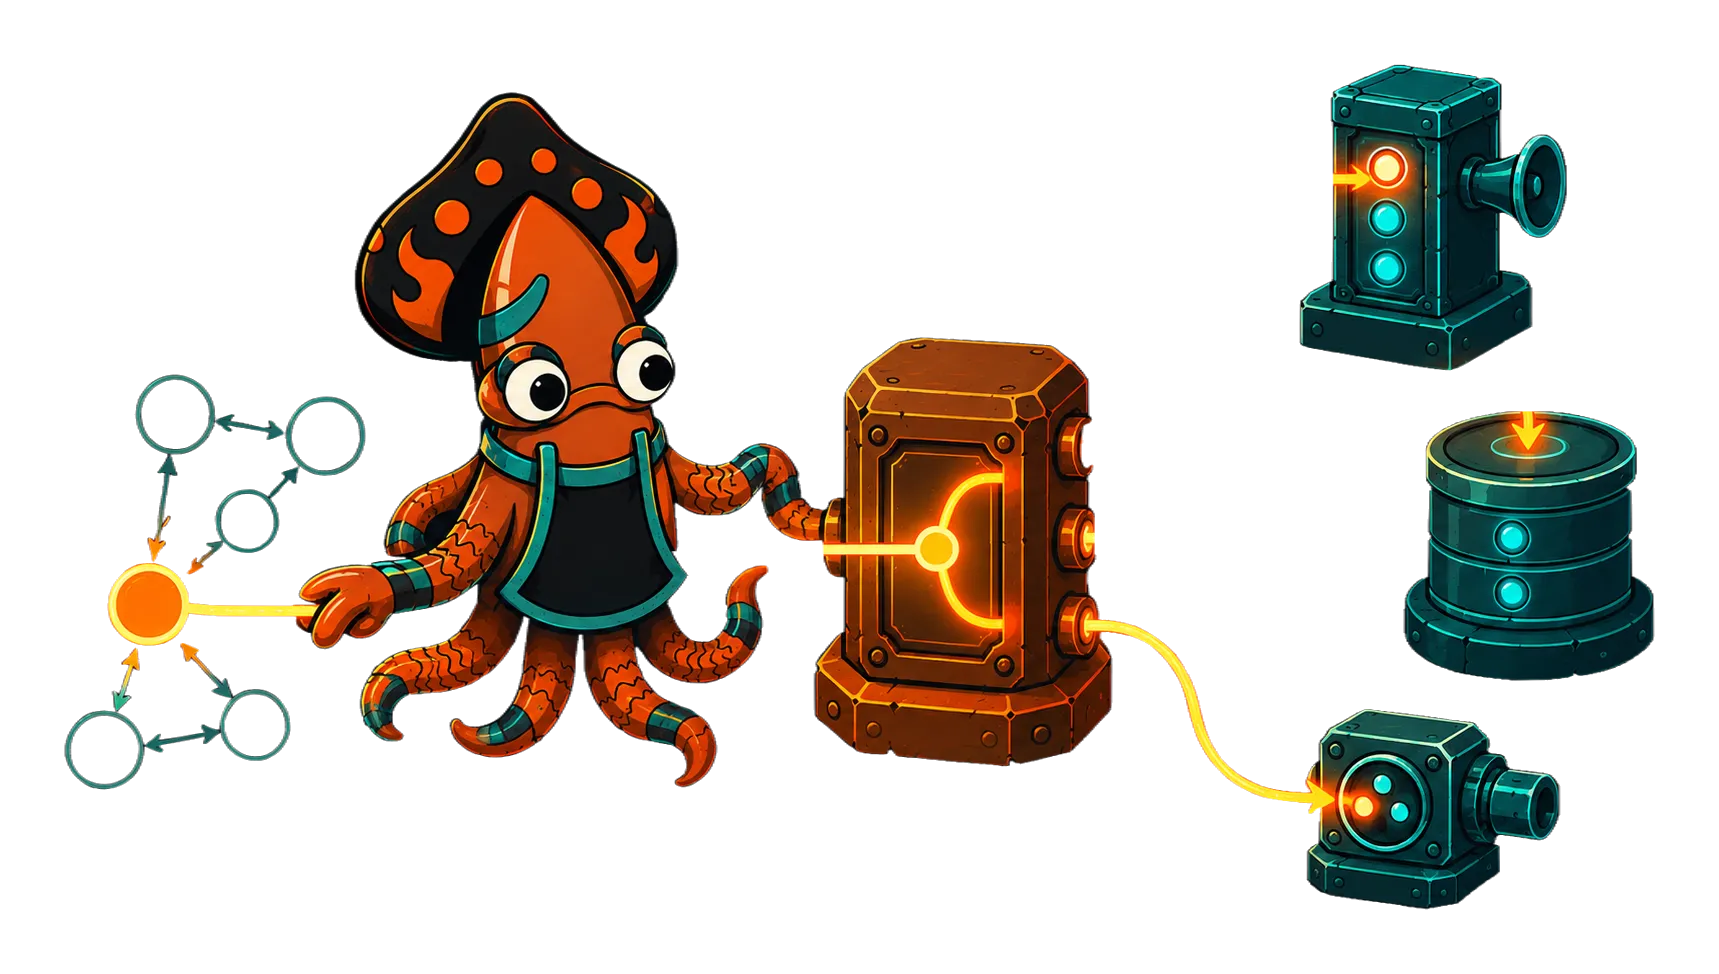
Context propagation is the seam
Section titled “Context propagation is the seam”Manifold.Sink starts the sink.Sink span on the context you pass and
propagates that context to every Outlet.Sink. So when the caller already holds
a span (a request span, or a state transition span),
the emit span nests underneath it, and each outlet’s own spans nest under
the emit. One trace tells the whole story: the transition that decided, the
fan-out that dispatched, and the writes that landed.
flowchart TD
    T["state.transition span"] --> E["sink.Sink span"]
    E --> D1["dynamo PutItem"]
    E --> D2["s3 PutObject"]
Because both modules speak the same crucible/telemetry interface, this works
with whatever backend you wire behind it (the telemetry module ships slog,
OpenTelemetry, and Datadog adapters), and sink never knows which one it is.